Outperform Institute and SkyGeni partner to engineer predictable revenue growth Learn more
Learn more
A growth round raises the revenue target and the board's expectations for board reporting at the same time. New board members want to know how the pipeline moved by segment and what revenue looks like three to four quarters out.
The Revenue Operations (RevOps) and Financial Planning and Analysis (FP&A) teams that answer these questions are usually the same size they were before the raise, so they spend their time assembling board reports rather than explaining them.
Board reporting changes after a raise because fresh capital raises the standard of proof. Bain & Company's 2026 Global Private Equity Report estimates that a typical buyout now needs 10 to 12 percent annual Earnings Before Interest, Taxes, Depreciation and Amortization (EBITDA) growth to earn a 2.5x return over five years, up from about 5 percent in the 2010s.
Private equity board reporting now focuses on the drivers of revenue, early and often, not only the result at quarter end. Growth equity and late-stage venture investors apply similar scrutiny.
The teams that produce board reporting rarely change at the same pace. In the 2025 FP&A Trends Survey, FP&A teams spent 46 percent of their time collecting and validating data rather than analyzing it.
Board reporting after a raise moves through five stages: before close, days 0 to 100, months 4 to 12, months 12 to 24, and month 24 onward. A problem that starts in one stage usually surfaces in the next, which is why its cause is so often misread: an untested assumption before close becomes a pipeline shortfall in months 4 to 12.
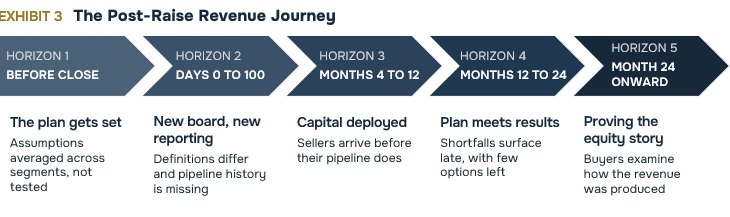
The growth model built for diligence becomes the operating plan the Chief Executive Officer (CEO) and leadership team are measured against. Its sales planning assumptions often apply one win rate, one sales cycle and one ramp time to the whole business. In an illustrative example, a 22 percent blended win rate looks achievable while the new segment round is meant to fund converts at 9 percent.
New directors often bring their own template for the board reporting package. It asks how the pipeline moved, while most Customer Relationship Management (CRM) systems record only where each opportunity stands today. If sales and finance define a qualified opportunity differently, every pipeline figure has to be reconciled first.
For the Chief Revenue Officer (CRO), capital goes into headcount before pipeline, but more sellers do not mean more revenue right away. The Bridge Group's 2026 research puts the average account executive ramp at 6.2 months, the longest in the study's history. With a roughly six-month ramp, a seller hired in month 4 may not reach full productivity until around month 10, so the plan can show full sales capacity while the pipeline to support it is still behind.
The first full year against the funded plan sets the credibility of the Chief Financial Officer (CFO) and the leadership team in reporting to the board. When a shortfall first shows up in the quarterly forecast, the options left are mostly discounting and pulling deals forward.
Investors examine the revenue engine as closely as the revenue: how the pipeline was created, how it converted and how accurate past forecasts were. A company without that record has to rebuild it under time pressure.
A board report after a raise needs to answer four questions that get deeper and more frequent soon after the raise, and the Software as a Service (SaaS) board deck has to answer each one:
The cadence here is an example and varies by board.
Forecasting three to four quarters out is the hardest part. In an illustrative four-quarter projection, about two-thirds of projected bookings come from the pipeline that does not exist yet. The real question becomes how much qualified pipeline each segment needs to create, and by when, to close the gap.
The Detection Horizon is how many quarters of warning leadership has between seeing a revenue deviation and that deviation hitting reported revenue. A board asking for a forecast three to four quarters out is asking for a Detection Horizon of three quarters or more.
AI tools alone cannot close the board reporting gap because the answers depend on the underlying machinery: pipeline history, shared definitions and forecasting models. A Large Language Model (LLM) can explain a figure, draft the commentary and challenge your assumptions. It cannot be the system behind multi-quarter sales forecasting: one that reconstructs segment-level pipeline history, learns conversion rates and cycle times from it, and recomputes the projection every time the data changes. That is deterministic engineering work.
Most CRMs store only the current state of each opportunity, so showing what moved means comparing snapshots. Snapshots sample state; movement is a sequence of events.
Six board reporting best practices set well-run post-raise companies apart:
Ask your team: If a board member asked today how our pipeline moved last month by segment, how long would it take us to answer, and would sales and finance give the same answer?
The Board Reporting After a Raise white paper covers each stage in depth: the questions boards ask, where leadership teams struggle to answer them, and the questions to ask your own team. It includes exhibits and a Readiness Map you can score in 90 seconds. Download the white paper before your next board meeting.
A board report after a raise should include pipeline movement by segment, leading indicators, a forecast three to four quarters out, what changed since the last forecast and why, and the new pipeline needed to close any gap to plan.
To improve sales forecast accuracy for board reporting, build the forecast from segment drivers, such as conversion rates, cycle times and pipeline creation rates, not a top-down cut. In the 2025 FP&A Trends Survey, 77 percent of organizations using driver-based models rated their forecasts good or great, yet only 17 percent used fully driver-based models.
Transparent board reporting earns a leadership team room to operate. A team that spots a problem early, explains why and shows its plan keeps the board's confidence; a team that keeps arriving with figures it cannot explain spends its credibility.
Present financial reports to a board against the funded plan, by segment, with each variance explained. Pair them with how the pipeline moved and a forecast three to four quarters out, so directors see where revenue is heading, not only where it ended up.
SkyGeni is the Explainable AI Revenue De-Risking platform. Growth-funded Business-to-Business (B2B) technology companies use SkyGeni in board reporting to show how pipeline moved, which segments convert and what revenue looks like three to four quarters out, with the reasoning behind every answer, to keep their commitments to the board.
See where your company stands: Take the 90-second post-raise readiness assessment.
Join revenue leaders across high-growth B2B companies who are using SkyGeni to spot risk earlier, build better pipeline, and grow predictably.


Empowering revenue teams to plan with precision, execute with confidence, outmaneuver competitors, and expand Lifetime Value. Let’s accelerate predictable revenue growth, together.


