

The Revenue De-Risking Platform
De-risk revenue execution. Catch risk before it impacts your forecast.
SkyGeni’s AI agents flag emerging revenue risk quarters early, so you can course correct in time and walk into every board meeting with answers, not surprises.

✓
Live in as little as 3 weeks
✓
No snapshot tables to build
✓
Works with Claude, ChatGPT and your agents
Trusted By











WHY FORECASTS MISS
The miss is the outcome. The cause started quarters earlier.
Pipeline came in light. Conversion slipped in one segment. Demand drifted away from your ideal customer profile. The signals were in the data, just not visible in time to act.
THIS QUARTER · FORECAST
$41.8M
−$6.2M vs plan
Plan $48.0M
PIPELINE
Came in light

3 QTRS AGO
CONVERSION
Slipped in one segment
2 QTRS AGO
DEMAND
Drifted away from ICP
LAST QTR
OUTCOME
Forecast misses plan

THIS QTR
Each signal was in the data at the time. SkyGeni surfaces it when it starts, not when it lands.
MICROSCOPE VS. BINOCULARS
Deal-level tools show you the tip. SkyGeni shows you the iceberg.
Tools like Clari and Gong are microscopes for the deals in front of you. SkyGeni gives leaders binoculars to see risk developing across the entire revenue engine, while there’s still time to course correct.
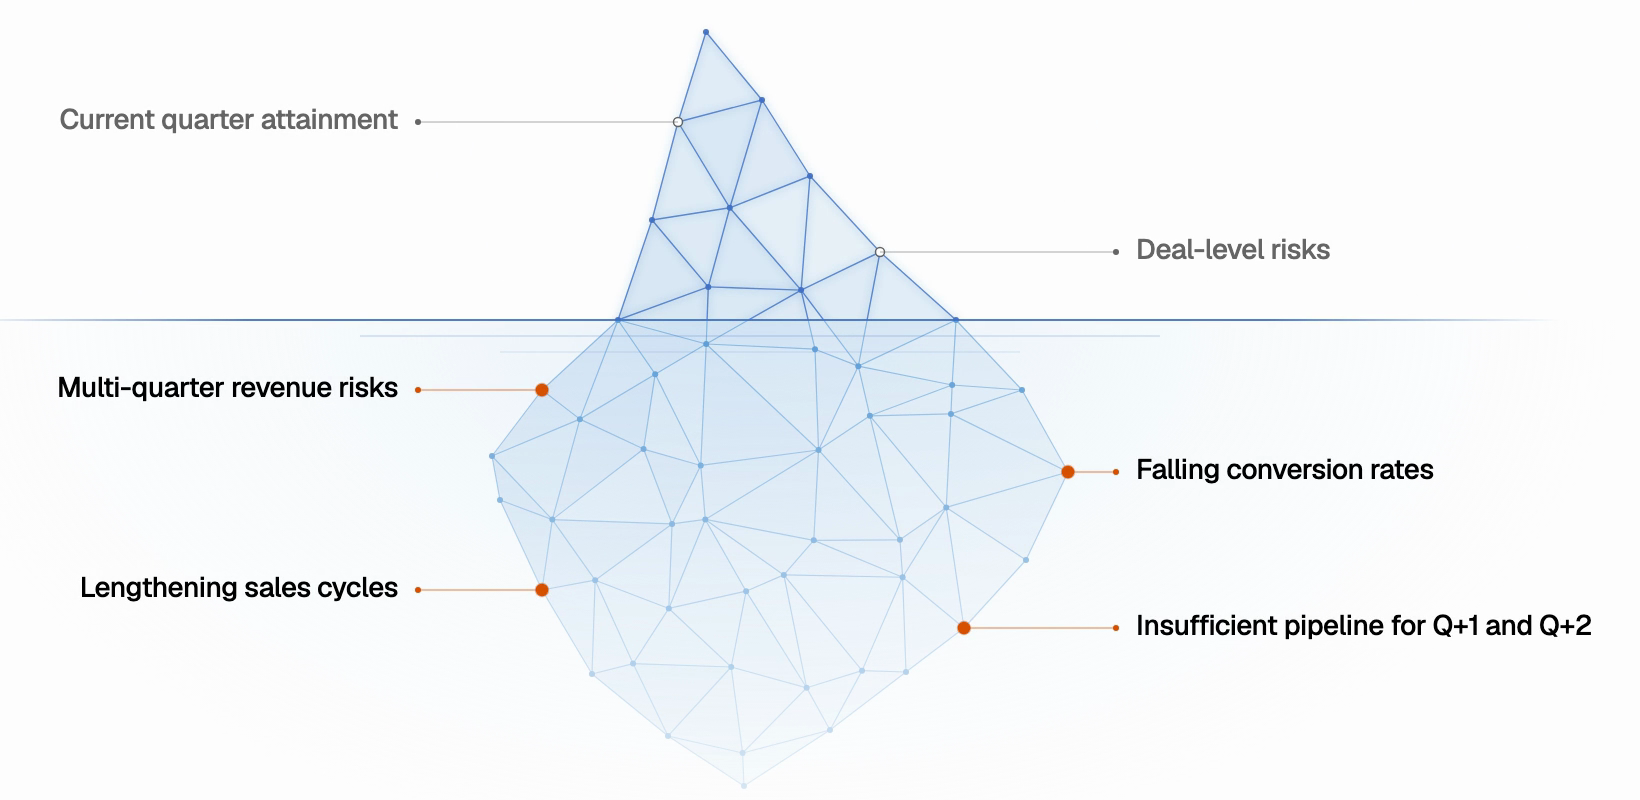
ABOVE THE WATERLINE
Microscope · deal tools
Answers
Is this deal at risk?
Horizon
This quarter
Sees
Current-quarter attainment, deal-level risk
BELOW THE WATERLINE
Binoculars · SkyGeni
Answers
Is the revenue engine at risk?
Horizon
This quarter through Q+4
Sees
Falling conversion, lengthening cycles, thin Q+1 and Q+2 pipeline
HOW SKYGENI DE-RISKS REVENUE
Detect risk. Understand why. Project what happens next.
Risk Spotter tells you what’s changing. Crystal Ball shows you what it could mean next.
01
Detect risk.
Act
Win Rate from Qualify
21%
vs. 28% median
Worst in 5 qtrs
Down 3 qtrs
02
Understand why.
WHY IT WAS FLAGGED
Deviation
Significantly worse vs median
Extremeness
Worst in 5 quarters
Trend
Down 3 quarters
Top driver
New Logos (64%)
03
Project what happens next.
NEXT FOUR QUARTERS
Quota
Projection
RISK SPOTTER
What’s changing, and why
CRYSTAL BALL
What it could mean next
RISK SPOTTER AI AGENTS
Always-on agents that flag what’s truly changing.
Risk Spotter continuously compares dozens of metrics, like pipeline creation, win rates and sales cycles, against plan and the same point in previous quarters.
✓
Compares against plan and prior quarters, like-for-like
✓
Separates a one-time event from a real trend
✓
Explains the drivers and where to investigate or act
Act
Win Rate from Qualify
✕
21%
vs. 28% median
30%
Q-4
29%
Q-3
27%
Q-2
24%
Q-1
21%
QTD
Deviation
Significantly worse vs median
Extremeness
Worst in 5 quarters
Trend
Down 3 quarters in a row
PRIMARY DRIVERS · % OF IMPACT
New Logos 64%
Expansion 29%
Renewals 7%
4 emerging risks flagged
Scanning: pipeline creation · win rates · sales cycles
AS OF · 100 DAYS AGO
TODAY

OPEN PIPELINE
$2.26M
COMMIT + BEST CASE
$1.06M
Change Log
12d ago
Kestrel Bank
Forecast
Best Case → Commit
34d ago
Kestrel Bank
Stage
Proposal → Negotiate
58d ago
Vantage Media
ACV
$240K → $190K
78d ago
Harbor Logistics
Stage
Qualify → Demo
140d ago
Brightline Health
ACV
$150K → $220K
Faded rows had not happened yet on the selected date.
TIME MACHINE
Your pipeline as it stood on any past date.
Behind every insight is SkyGeni’s Time Machine. It recreates your pipeline on any date, so every comparison with past quarters is like-for-like.
✓
No snapshot tables to build
✓
No complex logic to maintain
✓
Every stage, ACV and forecast-category change, on the record
CRYSTAL BALL
See the next four quarters before your board asks.
Crystal Ball projects revenue for Q+1 through Q+4 as a low, mid and high range against quota, so you can pressure-test your long-range forecast and walk into board meetings with a clear growth story.
✓
Multi-quarter projection with low / mid / high range
✓
Projection vs. quota, quarter by quarter
✓
Built on the same metrics Risk Spotter watches
Projection vs. quota · next four quarters
Q+1: $4.1M mid · $1.1M below quota
Q+1
Q+2
Q+3
Q+4
Quota
Low
Mid
High
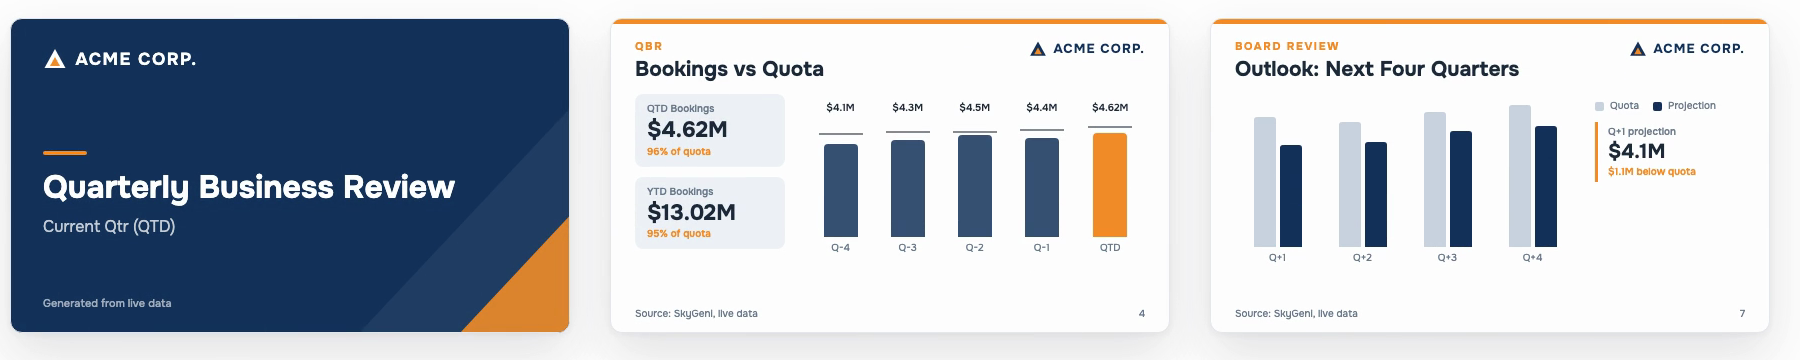
BOARD & QBR DECKS
Your branded QBR and board decks, generated from live data.
So nobody has to rebuild them by hand each time. Same numbers as the dashboards, in your own brand.
REVENUE SEMANTIC MCP LAYER
The same trusted numbers, inside Claude, ChatGPT and your own agents.
The metrics, algorithms and models behind SkyGeni also power your AI tools. SkyGeni calculates the numbers, so the model doesn’t have to.
Claude
ChatGPT
Your agents

Metrics
Algorithms
Models
10–20x
lower token cost
TOKENS PER ANSWER
Raw LLM
SkyGeni
Significantly faster, more trustworthy answers at 10–20x lower token cost than asking a model to work it out from raw data.
TIME TO VALUE
Live in as little as three weeks.
And the results show up in the numbers your board already tracks.
WEEK 1
WEEK 2
WEEK 3
✓ LIVE
~20%
Higher revenue per rep
Customer results
45%
Uplift in MQL-to-Won conversion
Customer results
2–3 qtrs
Earlier warning on revenue risk
Risk surfaced before it impacts the forecast
“
SkyGeni catches revenue risks before they impact the forecast.

Raja Hussain
CRO, Mobileum
“
I spend as much time in SkyGeni as I do in Salesforce.

Ken Lyons
CRO, Cleo
Predictable revenue growth starts with seeing what’s changing in time to do something about it.
De-risk revenue execution and give your board the visibility it demands.


