Outperform Institute and SkyGeni partner to engineer predictable revenue growth Learn more
Learn more
Pipeline coverage is the ratio of open pipeline value to the revenue target for the same period, expressed as a multiple: Pipeline Coverage Ratio = Open Pipeline Value / Revenue Target. A team carrying $9 million in pipeline against a $3 million target has 3x coverage.
A revenue team can enter a quarter at 3.2x pipeline coverage against a 3.0x target and still have a revenue miss already forming underneath the aggregate number.
Imagine Enterprise is carrying only 62% of the pipeline it needs and SMB is at 74%. If the normal sales cycle for those segments is longer than the time left in the quarter, neither can create and convert enough new pipeline in time. Mid-market and EMEA can still look healthy, so the company-wide pipeline coverage ratio clears the bar.
The problem is not the calculation. It is what the calculation leaves out.
What that ratio does not tell you is whether each segment has enough convertible pipeline given its own win rate, sales cycle, deal quality, and time remaining. That second question is pipeline sufficiency.
SkyGeni’s article “Revenue Forecasting: The Five Blind Spots Causing Unpredictable Revenue Execution” articulates how blind spots in revenue execution ultimately impact the revenue forecast. This article expands on the first of the five Revenue Execution Blind Spots: coverage mistaken for convertible pipeline. It matters because a shortfall in convertible pipeline is often very difficult to recover from.
This pattern is not isolated. McKinsey's 2026 Global B2B Pulse found a widening performance divide: 60% of self-identified market leaders reported double-digit revenue growth in 2025, versus 21% of laggards, with differences persisting across industries and geographies. The implication is broader than pipeline math: commercial execution choices materially shape growth outcomes.
Pipeline coverage, or the pipeline coverage ratio, compares the value of open pipeline with the revenue target for the same period. It answers a quantity question: how much pipeline do we have relative to the number we need to hit?
Teams often use a rule of thumb such as 3x or 4x coverage. The problem is that a single company-wide multiple quietly assumes the business converts pipeline at roughly the same rate and speed everywhere. In a multi-segment B2B organization, that is almost never the case.
Pipeline Coverage Ratio = Open Pipeline Value / Revenue Target
For example, $9 million in open pipeline against a $3 million revenue target equals 3x pipeline coverage. The formula is simple. The interpretation becomes more complicated once you ask which pipeline should count and whether it can convert in time.
Raw coverage counts every open opportunity at full value. Qualified coverage narrows the pool to opportunities that meet your organization's qualification criteria. Weighted coverage applies a probability to each deal, usually based on stage or another scoring method, before summing the expected value.
Those adjustments can make the aggregate signal more informative, but they do not answer the sufficiency question. A fully qualified or probability-weighted company-wide number can still hide a segment whose normal cycle time is longer than the time left to close the gap.
Suppose a $100,000 opportunity is assigned an 80% probability and a $200,000 opportunity is assigned a 30% probability. Their weighted values are $80,000 and $60,000, for $140,000 in weighted pipeline. Against a $100,000 target, weighted coverage is 1.4x.
That is a useful probability-adjusted view of the two deals. It still does not tell you whether the segment has enough total convertible pipeline, whether the probabilities are well calibrated, or whether the remaining sales cycle fits inside the period.
There is no universal good pipeline coverage ratio. A useful starting point is the inverse of the historical win rate for the segment:
Baseline Required Coverage = 1 / Historical Win Rate
A 25% win rate implies roughly 4x baseline coverage. A 20% win rate implies roughly 5x. A 50% win rate implies roughly 2x.
But win rate alone is not enough to establish pipeline sufficiency. That baseline assumes the historical win rate is relevant and that there is enough time for the opportunities to move through the segment's normal sales cycle. A segment with 4x coverage and a 90-day cycle may still be exposed if the shortfall appears with only 30 days left.
The practical implication is to derive coverage requirements separately for the segments that behave differently, using their own recent win rates and cycle times rather than applying one company-wide multiple.
A company-wide coverage multiple compresses very different revenue motions into one ratio. That creates four common blind spots:
This is why aggregate coverage can be numerically correct and operationally misleading at the same time.
Coverage answers how much pipeline exists. Pipeline sufficiency asks whether the pipeline in a specific segment can realistically produce the required revenue before the window to act closes.
Consider an illustrative example. The business is carrying 3.2x aggregate coverage against a 3.0x target. As a single number, the pipeline looks healthy. Read each segment against its own required pipeline and remaining cycle time, and the picture changes.
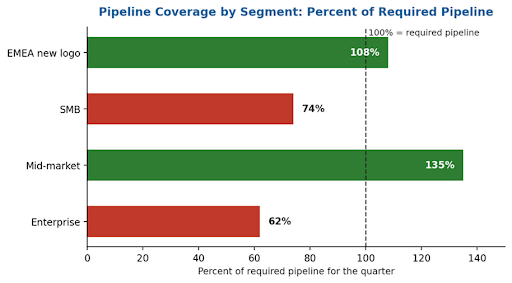
The same pipeline produces two readings. Company-wide coverage says the business is above target. Segment-level sufficiency shows that two cohorts are below required pipeline and do not have enough cycle time left to recover. The miss is not visible because the aggregate number averages the risk away.
Fixing the pipeline coverage vs. pipeline sufficiency blind spot means measuring coverage by segment rather than company-wide, then adding the timing check an aggregate number cannot provide. Three changes make that possible.
Break the aggregate number down by segment, region, product line, or other cohort with meaningfully different conversion economics. Hold each to its own required pipeline. If a segment is below requirement and its typical cycle time exceeds the time left, the organization should treat that revenue as structurally at risk rather than assuming the aggregate number will compensate for it.
Pipeline generated almost entirely in the final month can satisfy a quarterly coverage target while leaving too little time to convert. Coverage does not distinguish a steady creation pattern from a late sprint. Sufficiency should therefore govern both pipeline volume and the pace at which that pipeline is created.
Do not start with one company-wide pipeline number and split it proportionally across segments that have different win rates and cycle times. Build the requirement up from each segment's own conversion economics, then sum those requirements to the company level. Otherwise, the allocation can starve segments that can convert more efficiently and overfeed segments that cannot.
ASK YOUR TEAM If our two largest segments were measured separately, would either be structurally unable to make its number?
Pipeline coverage is a leading indicator of revenue capacity, not a forecast. A forecast asks what revenue is likely to close. Coverage and sufficiency ask whether the underlying conditions are in place to support that outcome.
Gartner's 2026 research on sales forecasting recommends focusing on three pipeline measures: initial pipeline value, pipeline conversion rate, and pipeline slippage rate, so teams can evaluate pipeline health and identify risk earlier.
SkyGeni's Revenue Execution Chain treats pipeline quality as an upstream link in a connected system:

A break presents downstream of its cause. A sufficiency failure can form earlier in the execution chain and appear later as a forecast miss. Better deal inspection may reveal the problem sooner, but it cannot create the missing convertible pipeline or restore cycle time that has already been lost.
That is the larger Revenue De-Risking point: the objective is not only to predict the outcome more accurately. It is to detect the execution condition early enough that leaders still have options to change it.
Pipeline coverage maturity improves as teams move from one assumed multiple to governed segment-level sufficiency.
SkyGeni defines Detection Horizon as the time, usually measured in quarters for enterprise sales organizations, between when a revenue deviation surfaces in your own data and when it becomes visible to leadership.
The progression should stay consistent with SkyGeni's Revenue Execution Benchmark Map:
The important shift is not from 3x to a more sophisticated universal multiple. It is from a single aggregate assumption to evidence-based requirements that reveal where the business is exposed while there is still time to respond.
Pipeline sufficiency measures whether a specific segment has enough pipeline that can realistically convert within the time remaining, using that segment's own win rate, cycle time, deal quality, and other relevant conversion signals.
Convertible pipeline is pipeline that a segment can realistically close within its normal sales cycle and the time left in the period. Pipeline that cannot convert in time may still count toward raw coverage, but it does not provide the same revenue capacity.
Unweighted coverage counts each open opportunity at full value. Weighted coverage applies a probability to each opportunity before summing the total. Weighting can improve the aggregate signal, but it does not by itself determine whether each segment has enough time and conversion capacity to hit its target.
The pipeline coverage formula is Open Pipeline Value / Revenue Target. For example, $9 million in open pipeline against a $3 million target equals 3x pipeline coverage.
Pipeline coverage measures how much pipeline exists relative to a target. Pipeline velocity measures how quickly opportunities move through the funnel. A team can have strong coverage and weak velocity if opportunities accumulate without progressing.
Pipeline coverage is useful, but the aggregate ratio is not the same as revenue capacity. A company can clear its coverage target while individual segments already lack enough pipeline, enough time, or enough conversion potential to make their number.
The more reliable operating question is not simply, “Do we have enough pipeline?” It is, “Does each segment have enough convertible pipeline to produce the revenue we need while there is still time to act?”
That distinction is the first Revenue Execution Blind Spot. The subsequent articles in this series will examine the other upstream conditions and blind spots that weaken revenue predictability before they impact the forecast.
SkyGeni helps B2B revenue leaders identify execution risks before they become forecast misses. Our approach to Revenue De-Risking starts from a simple conviction: the signals that determine future revenue often already exist in your data. The challenge is seeing them at the right resolution, in the right context, early enough to act.
SkyGeni connects signals across pipeline, conversion, customer expansion, and sales execution to help CEOs, CROs, Finance, and RevOps teams spot emerging risk, understand what is driving it, and focus action where it can have the greatest impact.
Join revenue leaders across high-growth B2B companies who are using SkyGeni to spot risk earlier, build better pipeline, and grow predictably.


Empowering revenue teams to plan with precision, execute with confidence, outmaneuver competitors, and expand Lifetime Value. Let’s accelerate predictable revenue growth, together.


