Outperform Institute and SkyGeni partner to engineer predictable revenue growth Learn more
Learn more
Sales forecast accuracy measures how closely a sales team's predicted revenue matches the revenue it actually closes in a given period, usually expressed as a percentage.
Consider an illustrative example (not client data). A company with a $10 million target makes a week-one projection of $10.2 million and a week-eleven commit of $8.7 million, then closes at $8.5 million. The week-eleven commit was 97.6% accurate. The week-one projection was only 80.0% accurate, and the target was missed by 15%. The conditions behind that shortfall were visible in the company's own data two quarters earlier.
Late-quarter accuracy is often a description of the present, dressed as a prediction of the future. The more useful question is how early leaders could see the risk.
This article covers the second blind spot in SkyGeni's Revenue Execution Blind Spots Series, based on our brief, The Five Revenue Execution Blind Spots. After our overview of the revenue forecasting blind spots and our guide to pipeline coverage vs. pipeline sufficiency, we now examine Blind Spot 2: risk seen only after the forecast breaks.
Sales forecast accuracy is the degree to which a sales forecast matches actual results for the same period. It shows how close a prior call was, not whether the team hit its target.
Sales forecast accuracy formula
Sales Forecast Accuracy (%) = [1 − (Absolute Error ÷ Actual Revenue)] × 100
where Absolute Error = |Actual Revenue − Forecasted Revenue|
In plain terms: find how far the forecast was from actual revenue, ignoring whether it was too high or too low (the vertical bars mean "absolute value"). Divide that gap by actual revenue, subtract the result from 1, and multiply by 100 to get a percentage.
Sales forecast accuracy example: A company closes the quarter with actual revenue of $8,500,000. Its week-one projection was $10,200,000, and its week-eleven commit was $8,700,000. Applying the formula to each:
The quarter and the actual result are the same in both columns. Only the timing changed, and accuracy moved from 80.0% to 97.6%. This is the distinction our brief draws between week-one projection accuracy, which reflects predictability, and week-eleven commit accuracy, which is largely arithmetic.
Teams tracking many periods often add three measures: mean absolute percentage error (MAPE), the average size of the percentage error across periods; weighted mean absolute percentage error (WMAPE), which weights each error by revenue so larger segments count for more; and forecast bias, which shows whether misses lean consistently high or low.
There is no universal standard for a good sales forecast accuracy percentage. Many teams set an internal tolerance, such as landing within 5% or 10% of actual results, and the tighter range is harder to hold quarter after quarter. Confidence is limited as well: Gartner's State of Sales Operations survey found that only 45% of sales leaders and sellers have high confidence in their organization's forecasting accuracy.
Timing matters too. Short-range forecasts are generally more accurate, so late-quarter accuracy mostly confirms what has already happened. Our brief recommends reporting week-one projection accuracy to the board.
Sales forecasts are usually inaccurate because of their inputs, not their math. No method, whether time-series, pipeline forecasting, or AI-driven, can fix distorted or late inputs.
In Harvard Business Review, Bob Suh argues that most forecast inaccuracy stems from human behavior. Sellers withhold bad news and stay optimistic about troubled deals. He advises watching deal age, because the longer a deal stays open, the less likely it is to close. Better algorithms applied to distorted inputs tend to produce more confident wrong answers.
In Sales Management That Works (2021), Frank Cespedes notes that a CRM stage model encodes the seller's process rather than the buyer's progress. Stage-weighted forecasts inherit that distortion.
Forecast error is a lagging indicator of execution. In our experience, the deviations behind a miss often appear in a company's own data two to three quarters before the forecast reflects them.
The blind spot is that revenue risk is often recognized only after it has changed the forecast, when fewer responses remain. Our brief describes the reactive pattern that follows:
The deviation is the same whenever it is noticed. What changes is the responses available: reallocation and redirection early, or discounting and heroics late.
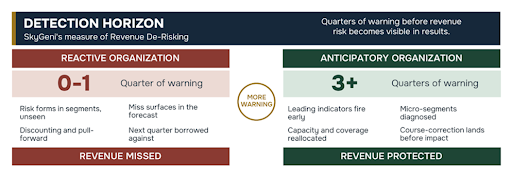
Sales forecast accuracy tells leaders whether their forecast was right. Detection Horizon tells them whether they had time to act. SkyGeni defines Detection Horizon as the time, usually measured in quarters for enterprise sales organizations, between when a revenue deviation surfaces in your own data and when it becomes visible to leadership. It is SkyGeni's measure of Revenue De-Risking.
EXECUTIVE TAKEAWAY: A forecast can tell you the number will be missed. Detection Horizon tells you while you can still change it.
Reactive organizations run at zero to one quarter of warning; anticipatory organizations run at more than three. Detection Horizon is the natural KPI to pair with forecast accuracy, because the larger value of early signals is time to change execution.
Lagging indicators measure outcomes that have already happened. Leading indicators change first, giving leaders time to act. Revenue teams need both leading and lagging indicators.
Many sales teams track activity-based indicators, such as calls made or meetings booked, which help predict how much new pipeline will be created. The indicators below answer a different question: is revenue that is already in the pipeline at risk?
In conversations with dozens of B2B revenue teams, we see leaders examining every deal under a microscope while almost nobody picks up the binoculars. Deal risk scoring flags single deals; revenue risk detection watches segments, in the right context.
In SkyGeni's Revenue Execution Chain, revenue visibility is the link between pipeline quality and decision-making. It means seeing revenue risk while it can still be acted on.
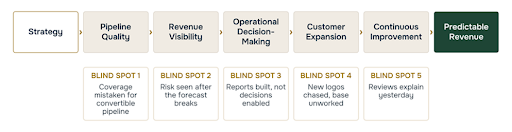
Two laws of the chain explain why this blind spot persists. A break presents downstream of its cause, so a Q1 sufficiency failure can appear as a Q3 forecast miss. And a downstream fix cannot repair an upstream break: better visibility reveals a miss earlier but does not prevent it. It buys time for decision-making, the next link.
How does pipeline visibility shape the revenue forecast? It determines how early the forecast can reflect reality. Segment-level visibility captures risk while it forms; deal stages and commit calls alone register it only after results are affected.
Most advice on how to improve forecast accuracy starts with consistent stage definitions and clear forecast categories. Those foundations matter, but the most effective way to improve sales forecasting accuracy is to see revenue risk earlier, which raises confidence in the number and buys time to change execution. Our brief recommends three changes for this blind spot:
Two further practices extend your Detection Horizon:
ASK YOUR TEAM In our last three missed quarters, in which week did the miss become mathematically unavoidable, and can we answer from data rather than memory?
Detection Horizon improves as an organization moves from explaining past quarters to watching the leading indicators that predict future ones. Our brief, The Five Revenue Execution Blind Spots, defines Detection Horizon as the time, usually measured in quarters for enterprise sales organizations, between when a revenue deviation surfaces in your own data and the moment it becomes visible to your leadership. The longer that window, the more room leaders have to act before a miss lands.
SkyGeni's Revenue Execution Benchmark Map tracks this capability, called Foresight and Learning, across four maturity levels. The step that matters most is the move from Articulated to Instrumented, where an organization stops describing execution and starts measuring the signals behind it.
The goal is not to become anticipatory overnight. It is to extend your Detection Horizon one level at a time, so revenue risk is seen further ahead and acted on before it impacts the forecast.
Detection Horizon is SkyGeni's measure of warning time: the time between when a revenue deviation surfaces in a company's own data and when it becomes visible to leadership.
No. Sales forecast accuracy compares the forecast with actual results. Target attainment compares actual results with the goal. A team can forecast a missed quarter precisely.
Forecast error measures how far a forecast missed, in either direction. Forecast bias measures whether misses consistently lean high or low, which usually signals a behavioral pattern.
Coverage mistaken for convertible pipeline, risk seen only after the forecast breaks, reports built instead of decisions enabled, new logos chased while the installed base goes unworked, and reviews that explain yesterday. See our overview of the five revenue forecasting blind spots.
Sales forecast accuracy answers a narrow question: how close was the call? Sales predictability depends on a different one: how early did we see the risk, and was there still time to act? That is the second Revenue Execution Blind Spot, and like the others, it is not a forecasting problem. Next in the series: reports built instead of decisions enabled.
Each article in the series, based on our brief The Five Revenue Execution Blind Spots, covers one blind spot. Start with Revenue Forecasting: The Five Blind Spots.
SkyGeni helps B2B revenue leaders identify execution risks before they become forecast misses. Our approach to Revenue De-Risking starts from a simple conviction: the signals that determine future revenue often already exist in your data. We connect them across pipeline, conversion, and customer expansion so leaders can act early.
Join revenue leaders across high-growth B2B companies who are using SkyGeni to spot risk earlier, build better pipeline, and grow predictably.


Empowering revenue teams to plan with precision, execute with confidence, outmaneuver competitors, and expand Lifetime Value. Let’s accelerate predictable revenue growth, together.


