Outperform Institute and SkyGeni partner to engineer predictable revenue growth Learn more
Learn more
White space analysis identifies the products or solutions an existing customer has not yet purchased, as well as the business units or buying centers you have not yet sold into. It is an important starting point for customer expansion, but identifying what is missing is not the same as knowing what each customer is most likely to buy next.
Most B2B revenue teams have a well-defined system for acquiring new customers. They identify target accounts, build pipeline, track conversion, inspect deal progression, and forecast expected revenue.
Expansion inside the installed base is often managed very differently. The question, “What is this customer most likely to buy next?” is still frequently answered through account knowledge, sporadic planning, and individual judgment.
Customer expansion is one link in the broader Revenue Execution Chain behind predictable revenue growth. The blind spot in this link is that new logos are systematically pursued while expansion sits unworked.
The issue is not simply whether companies can see the white space at each of their accounts. Most can. The real challenge is turning that white space into an actionable expansion pipeline by qualifying it, ranking it, assigning ownership, and managing it with the same discipline applied to new logo opportunities.
White space analysis maps what each existing customer already owns against what else they could buy. In account management, white space is the unsold opportunity across products, services, business units, regions, or buying centers.
Most B2B companies already have the data to build this view in their CRM and billing systems. The result shows what is owned and what remains open white space.
Growth from existing customers is usually faster and less expensive to win than new logos, because the relationship, the contract, and the proof of value already exist. White space analysis is how that growth gets located rather than assumed. It also gives revenue leaders a view of expansion capacity across the installed base, which is the difference between planning and successfully driving expansion versus just hoping for it.
Identifying where white space exists is only the first step. The real value comes from determining which gaps represent credible expansion opportunities and which do not.
White space and expansion opportunity are not the same thing, and treating them as the same is where expansion planning goes wrong.
White space is descriptive. It says the customer has not currently bought this. Every product a customer has not bought is white space, including products that do not fit their industry, their size, their technical environment, or their budget cycle.
An expansion opportunity is white space with evidence behind it. The customer resembles accounts that bought this product before. Their usage of what they already own has grown. A buying center that hasn’t bought before exists and has a budget. The gap is not just open, it is plausible.
The difference matters because of volume. An installed base of 200 accounts and six products contains 1,200 account-product combinations. A large share of those are open. A team that treats every open combination as an opportunity spreads effort across all of them, which in practice means choosing by familiarity rather than by evidence.
Most white space analysis stops at visibility. The account-product grid shows what each customer has not bought, but it does not show what that customer is most likely to buy next.
That matters because customer readiness changes, broad rules miss differences between accounts, and manual prioritization leaves expansion decisions to individual judgment.
We have covered these limitations in Why Spreadsheets Are Failing Customer Success and The Hidden Cost of Spreadsheet-Driven Expansion.
The implication here is simple: white space visible in a CRM is a list of what is missing. White space ranked by modeled propensity is a pipeline.
THE INSIGHT: A white space map tells you what could theoretically be sold. It does not tell you exactly where your team should spend time now.
Whitespace visible in a CRM is a list of what is missing. Whitespace ranked by modeled propensity is a pipeline. Ranking is what turns account information into an expansion decision, and it is the practical test of whether revenue intelligence is working inside the installed base.
ASK YOUR TEAM: Can we name the next product each account is most likely to buy, and say why? If not, what decides where expansion effort goes today?
Map each account across the products it has purchased and the business units or buying centers you have already sold into, using CRM, billing, and product data. This shows what is already covered and where white space remains..
Use past conversion evidence to identify the customer profiles and patterns associated with successful expansion. The same evidence should also help refine which customer segments are most promising for both expansion and new logo acquisition.
Evaluate the remaining white space for fit and readiness. Does the product fit the customer? Does the relevant buying center exist? Are there signals that make an additional purchase plausible? Remove opportunities that do not pass those tests.
Score the remaining opportunities by Modeled propensity to buy for each installed base account, using purchase history, usage signals, firmographics, and patterns associated with past expansion wins.
Every account should have a ranked list of specific products or solutions it is most likely to buy next, rather than simply a list of what it has not yet purchased.
Because readiness changes over time, the ranking should change with it.
Assign the highest ranked opportunities to owners with expected value and timing, then manage them alongside the new logo pipeline. If an opportunity is ranked but not owned, pursued, and reviewed, it is still not in the pipeline.
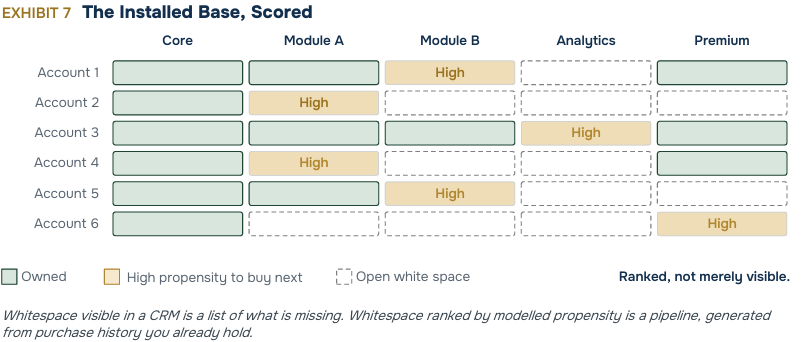
This matrix shows the difference between visible white space and ranked white space.
Green cells show the products each customer already owns, dashed cells show where product opportunities remain open, and gold cells identify the products each account has the highest modeled propensity to buy next.
The point is simple: white space visible in a CRM is a list of what remains unpurchased. When that white space is ranked by modeled propensity using purchase history and existing customer signals, it becomes an actionable expansion pipeline.
Ranked white space turns installed-base potential into an expansion pipeline. For cross-sell, it helps identify the product or module a customer is most likely to buy next. For upsell, it helps identify opportunities to expand an existing product relationship through additional seats, greater usage, or a higher-tier offering.
Both can contribute to Net Revenue Retention (NRR), but NRR is the outcome, not the operating signal. Cross-sell, upsell, contraction, and churn are driven by different factors and require different interventions.
That is why revenue leaders need to manage the drivers of NRR, not just the aggregate metric, and examine those drivers at the segment or micro-segment level.
The relationship matters commercially. McKinsey analyzed more than 100 B2B SaaS companies and found that companies in the top quartile of valuation multiples had a median Enterprise Value-to-Revenue (EV / Revenue) multiple of 24x, compared with 5x for companies in the bottom quartile.
The same groups reported median NRR of 113% and 98%, respectively. This does not establish causation, but it reinforces the association between stronger existing-customer growth and stronger financial performance.
The Revenue Execution Chain treats predictable revenue as the output of connected links: strategy, pipeline quality, revenue visibility, operational decision-making, customer expansion, and continuous improvement.
Customer expansion sits between operational decision-making and continuous improvement.
Earlier blind spots in this series focused on the pipeline you are building, the risk within that pipeline, and how quickly decisions follow the data.
This blind spot asks a different question: where is commercial effort being directed? A company can identify risk early, make decisions quickly, and still leave a significant share of available expansion revenue unworked.
The consequence appears downstream. An installed base that is not systematically ranked and prioritized in the first half of the year may not look like an expansion problem at the time. The impact often surfaces later as weaker expansion revenue, lower NRR, and greater pressure on new logo acquisition to make up the gap.
A stronger customer expansion motion starts with treating the installed base with the same analytical rigor as new-logo acquisition.
In SkyGeni’s Revenue Execution Benchmark Map, more mature organizations continuously quantify customer expansion rather than reviewing it periodically.
The practical test is simple: can you rank every account by its likelihood to buy a specific next product, and support that ranking with data?
White space analysis identifies the products or solutions an existing customer has not yet purchased, as well as the business units or buying centers you have not yet sold into. Revenue teams use it to find cross-sell and upsell opportunities across the installed base, most often by mapping accounts against offerings in a matrix.
White space is any product a customer has not bought. An expansion opportunity is white space supported by evidence that the customer could plausibly buy: a matching profile, an existing buying center, and adoption signals that indicate readiness.
Greenfield usually refers to net-new accounts that have never purchased, while white space refers to unsold opportunities inside current customers. The terms are not applied consistently, and some organizations use greenfield for entirely new markets. The two are managed differently regardless of the label.
Map accounts against products, business units, and buying centers. Segment by the characteristics that drove past expansion. Qualify each open cell for fit and budget authority. Rank what remains by propensity to buy. Then assign the top opportunities to owners with dates.
Cross-sell means selling a customer a different, adjacent product. Upsell means selling more of, or a higher tier of, something they already own. Both raise net revenue retention, but they respond to different signals and are found in different data.
White space is also called white space opportunity, whitespace, expansion opportunity, or account penetration gap. In key account management it is sometimes called account landscape mapping.
SkyGeni is the Explainable AI Revenue De-Risking platform for B2B revenue teams. It surfaces execution risk and expansion potential while there is still time to act on them, rather than after the forecast has been impacted.
To drive systematic expansion within the installed base, SkyGeni ranks every account by what it is most likely to buy next, using a Machine Learning model that learns from all purchases made by all past and current customers. This helps customers drive expansion based on evidence instead of relationships, and manage expansion with the same rigor as a new logo pipeline.
Join revenue leaders across high-growth B2B companies who are using SkyGeni to spot risk earlier, build better pipeline, and grow predictably.


Empowering revenue teams to plan with precision, execute with confidence, outmaneuver competitors, and expand Lifetime Value. Let’s accelerate predictable revenue growth, together.


