Outperform Institute and SkyGeni partner to engineer predictable revenue growth Learn more
Learn more
When revenue misses repeat, the reflex is to fix the forecast: more deal inspection, tighter commit calls, another CRM requirement. But the forecast only estimates the outcome. That outcome is produced by revenue execution, the connected system of strategy, pipeline quality, revenue visibility, decision-making, customer expansion, and continuous improvement that turns a plan into closed revenue.
Together, these links form the Revenue Execution Chain, and when the number misses, the cause usually lies in one of its links rather than in the prediction. These recurring weaknesses are the five revenue execution blind spots, each weakening a different link, and they surface early: the deviations behind a miss appear in a company’s own data one, two, or sometimes three quarters ahead of the forecast.
This is the final article in our series on the Five Revenue Execution Blind Spots, which examines how underlying execution weaknesses, rather than forecasting alone, contribute to revenue misses. The series overview introduced the Revenue Execution Chain, and five articles followed, one for each blind spot: pipeline sufficiency, sales forecast accuracy, RevOps best practices, white space analysis, and sales performance reviews. This article connects the five blind spots and explains where to start.
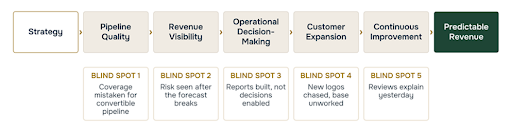
Strategy is the starting point of the Revenue Execution Chain. It has no blind spot of its own, but a weakness here cascades into the five blind spots that follow. In Aligning Strategy and Sales, Harvard Business School’s Frank Cespedes explains why strategy must translate into clear customer-selection criteria. Without this alignment, organizations risk becoming better at selling to customers who are increasingly less relevant to their strategy, a problem Cespedes describes as a competency trap.
Not every revenue miss stems from all five blind spots, but a weakness in one link can compound problems across the Revenue Execution Chain. Consider an illustrative company (not client data) entering a new market segment without clearly defined customer-selection criteria.
In the first quarter, the company reports 3.4x pipeline coverage against a 3.0x target. The new segment also appears healthy at 3.1x. However, sellers pursue customers with different buying behaviors, and the segment wins just 15% of its deals, well below the 33% win rate implied by the coverage target under a simplified calculation. At its actual win rate, the segment needs approximately 6.7x coverage, leaving it with less than half the required pipeline. The first blind spot emerges: aggregate coverage masks insufficient convertible pipeline.
By the second quarter, deals are aging beyond their expected close dates, but forecast commitments remain unchanged. The warning signs are already visible in the pipeline data, even though the forecast has yet to reflect the growing risk. The second follows: risk becomes visible only after the forecast breaks. When the issue reaches leadership, discussions focus on reconciling deal numbers rather than deciding how to respond. Then the third: reporting absorbs the effort that should go into the decision, and the response is delayed.
By the third quarter, the pipeline shortfall is too large to recover through new-logo acquisition alone. Expansion opportunities within existing accounts might have helped offset part of the gap, but without a prioritized view of each account’s likelihood of purchasing an additional product or solution, the company has fewer options. The fourth appears: new logos are chased while the installed base goes unworked. The quarter ends in a revenue miss.
The Quarterly Business Review (QBR) then focuses on sellers’ quota attainment and recommends coaching, overlooking the more fundamental problem: pipeline built around the wrong customers. And the fifth: the review explains yesterday instead of diagnosing what to change. Without identifying the root cause, the organization risks carrying the same weakness into the next planning cycle.
The lesson is not that every revenue miss follows this sequence. An upstream weakness compounds downstream, and the longer detection and action take, the fewer options remain for recovery.
Identifying the problem in the first quarter provides more time to correct customer targeting and rebuild the pipeline. Discovering it in the third makes recovery considerably harder.
The goal is not more reporting, but making each link measurable enough to reveal risk early and actionable enough to act while there is still time.
| Link | Common approach | Instrumented approach |
|---|---|---|
| Strategy | Strategy remains at the planning level | Sellers can identify the accounts they should not pursue this quarter and explain why |
| Pipeline Quality | One company-wide pipeline coverage multiple | Pipeline sufficiency measured by segment using recent win rates and sales cycle lengths |
| Revenue Visibility | Forecast categories trigger attention only after risk reaches the forecast | Leading indicators surface revenue risk before the forecast deteriorates |
| Operational Decision-Making | Different business functions use inconsistent metric definitions | One governed set of metric definitions |
| Customer Expansion | Net Revenue Retention (NRR) tracked as an aggregate outcome; white space listed but not prioritized | NRR drivers tracked separately; accounts ranked by modeled propensity to buy next |
| Continuous Improvement | Reviews center on quota attainment | Seller conversion efficiency evaluated alongside pipeline received |
Detection Horizon measures the time between when a revenue deviation becomes detectable in company data and when leadership recognizes it. Decision velocity measures how quickly an identified risk leads to action. Together, they help assess whether the organization can identify emerging problems early and respond before revenue outcomes are affected.
The Revenue Execution Benchmark Map evaluates six capabilities across four maturity levels: Assumed, Articulated, Instrumented, and Anticipatory. Each capability is assessed against the highest level supported by evidence, with the organization's overall maturity constrained by its weakest capability.
Detection Horizon ranges from zero to one quarter at the Assumed level to more than three quarters at the Anticipatory level.
For a deeper assessment, our brief, The Five Revenue Execution Blind Spots, includes the full Benchmark Map and the criteria behind each maturity level. Leadership teams can use it before a QBR to identify which capabilities are supported by data and where execution is most exposed.
Sales execution is how effectively sellers progress opportunities from qualification through close. Revenue execution is broader: it covers the full system that produces revenue, from pipeline quality through continuous improvement.
A revenue process is the sequence of stages a company runs to generate revenue, from strategy and pipeline creation through conversion, customer expansion, and renewal. Revenue execution is how well an organization runs that process: the Revenue Execution Chain links those stages, and a weakness in any one limits the result.
SkyGeni is the Explainable AI Revenue De-Risking platform. It helps B2B technology companies identify emerging revenue risks before they impact the forecast, improve conversion efficiency, and deliver more predictable growth.
By connecting pipeline history, segment-level performance, and leading indicators, SkyGeni gives revenue and finance leaders a company-wide view of pipeline movement, growth risks, and revenue projections three to four quarters ahead. Every insight comes with supporting evidence, enabling leadership teams to act earlier and provide the visibility their boards demand.
Join revenue leaders across high-growth B2B companies who are using SkyGeni to spot risk earlier, build better pipeline, and grow predictably.


Empowering revenue teams to plan with precision, execute with confidence, outmaneuver competitors, and expand Lifetime Value. Let’s accelerate predictable revenue growth, together.


